29 Luglio 2013
POST TECNICO. AZIONI
Is Apple Fairly Valued?
The main approach to looking at this company is by focusing on the free-cash-flow, and a secondary approach is to check the results based on a Peers Evaluation model. The purpose of this two-tiered approach is to try to understand if it makes sense for an investor to buy shares in this company based on its current situation.
This company has experienced an uncommon extraordinary growth over time due to its worldwide success, as almost everyone knows, of some of its products. We are talking about roughly an Operating Cash Flows’ 40% CAGR (compounded annual growth rate) along a 14- year time stream. A shared understandable concern may arise from such amazing growth: could it keep growing in the future? What if it doesn’t? Keeping in mind that rapid growth may be followed by rapid decline.
To reassure you, let’s have a quick overview on some of its figures: $400.6bn of Market Cap, $42.6bn of piled Cash, $169.4bn of ttm revenues, $37.7bl of ttm earnings, $123.3bl of equity and a newly undertaken financial debt of around $17bn that was completely absent from the balance sheet before, which gives a very small debt/equity ratio of just 0.14 along with some good fiscal reliefs.
It has also recently showed to be a shareholder-friendly company that is beginning to pay dividends (with a current healthy dividend yield equal to 2.8%)
So let’s now focus on a free cash flow valuation frame.
Generally speaking (as already mentioned in previously edited articles), the FCF is what remains after deducting what is strictly needed for survival from all the cash produced by an industrial company (as opposed to financial or insurance one) in one year. From the point of view of an investor, this FCF is what really matters, as it's the real added value that may be entirely distributed to the stakeholders without compromising a company's existence. Here it can be defined as net cash provided by operating activities less purchases of property, plant and equipment. This is a clear simplification so it should not be inferred that the entire free cash flow amount is available for discretionary expenditures. FCF is a useful measure of performance that may be used as an indication of the strength of a company and its ability to generate cash. By projecting the FCF to the future and discounting it back (employing the so-called weighted average cost of capital, after having performed some other technical steps), it's possible to reach the fair value of stock compared with its market price.
Turning to AAPL it has generated a total operating cash flow for the last 12 months equal to $52.9bn and capital expenditures totalling $9.7bn, so the total FCF is $43.2bn with the weighted average cost of capital computed at 8.5%. Using adjusted data from the most recent available annual report, the estimated impact of operating leases, outstanding stock options, retirement and postretirement unfunded obligations, are a combined $5.8bn.
A reasonable FCF growth rate for the long term (over ten years) could be estimated at 2.8% which is equal to growth rate projections for the overall world economy.
Given all the above-mentioned assumptions, based on AAPL current share market price ($440.61, closing price on 28 July 2013) it may be inferred from the market a projected FCF growth rate for the short/medium term (up to 10 years) of -6%. This rate is apparently too harsh given that ttm FCFs still seems to be on an upward trend even if they have lowered from the previous quarter (definitely at a lower extent). This leads to the consideration that the company may be undervalued at the current price.
Let’s turn to the Peers Evaluation model. This is a proprietary copyrighted model (PEA© Peers Evaluation Analysis) that is based on some basic assumptions, which makes it rational and useful, even if cannot be taken as a standalone evaluation method. Indeed it isn’t precise, nor specific, but may be useful to gather some important evidence from comparisons. However, a major drawback of this model is that a company may operate in different fields at the same time which makes it difficult to be assigned to a specific bundle.
The main assumption is that if we take a bundle of companies belonging to the same business field on the long run, each single company will tend to reach the same average financial metrics (otherwise they will exit the market). The same assumption must be true also for new entrants. In practice, fundamental ratios from profit and loss, balance sheet, and cash flow statements, as P/S price to sales, P/EBIT price to operating income, P/E price to earnings, P/BV price to book-value, as well as P/FCF price to free cash flow, should lean towards the average bundle value in the long term. A further assumption of the model answers the question: what if? What would be the price of a peer company if its fundamental ratio is the average one? This price is then computed for each ratio and the next step is to find out the average price of the results. This final figure is the one to be compared with the stock price to gain a sense of potential over/under/fair valuation.
Saying that, here is what was computed for the bundle of companies to which AAPL belongs.
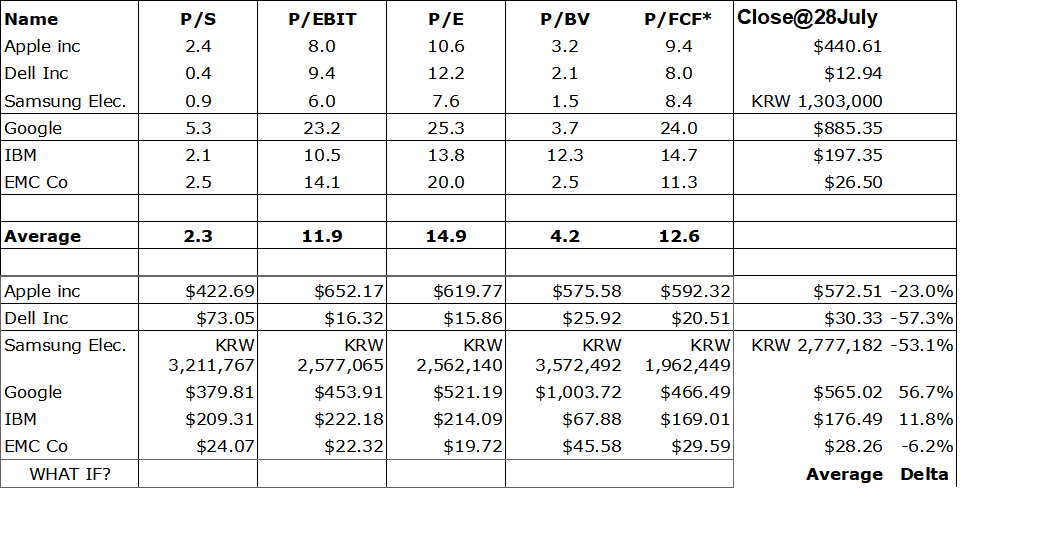
*note: capex inclusive of intangibles.
As you can see if AAPL would be the “ideal” company it is undervalued.
To conclude, there is evidence that this company based on a DCF model is undervalued as supported also by a Peers Evaluation model
Disclosure: I wrote this article myself, and it expresses my own opinions. I am not receiving compensation for it. I am long AAPL. I have no business relationship with any company whose stock is mentioned in this article. Note.
Tutti i diritti sono riservati - Copyright DIAWONDS® 2013.